Sources checked: October 28, 2026
Imagine seeing a news item about a new drug: “The risk of disease progression or death was reduced by 30%.”
How much longer does that mean patients can live? How much longer can tumor growth be delayed? Will they feel any better during treatment?
These questions require different kinds of evidence.
In a clinical trial, “effective” rests on a specific foundation: researchers first decide which patients to study, which treatment to compare against, and which outcome to observe.
The outcome chosen in advance to evaluate a treatment’s effect is called an endpoint.
In this article, we begin with a few concrete questions to examine how research establishes efficacy and compares the results from different patients.
1. Was the improvement really caused by the drug?
A patient may improve after taking a drug for many reasons: fluctuations in the disease itself, other treatments, better care, or a greater likelihood of improving in the first place.
If most patients receiving the drug have milder disease, while most in the control group have more severe disease, a greater number of survivors in the drug group cannot be attributed entirely to the drug. Differences that existed between patients beforehand can affect our judgment of efficacy.
The streptomycin trial for pulmonary tuberculosis published in 1948 is a landmark of modern randomized controlled research. Random assignment reduced the bias that could arise if doctors selected who received the new drug: 55 people received streptomycin plus bed rest, and 52 received bed rest alone. [1]
Random assignment cannot guarantee that two groups are identical. It can, however, reduce the systematic concentration of factors affecting outcomes in one group. The original report considered the groups broadly comparable; on some measures, patients in the drug group were actually more severely ill.
Within six months, 4 people in the drug group and 14 in the control group died. This provided strong evidence of streptomycin’s short-term efficacy. The study also observed resistance and subsequent deterioration in some patients, showing that short-term efficacy was still some distance from long-term disease control and cure. [1]
The importance of this example lies both in the results and in the way the comparison was made. In 1962, U.S. drug regulation further clarified that new drugs required substantial evidence of effectiveness before marketing, including adequate and well-controlled investigations. [2]
The comparator need not be a placebo. For a disease that already has effective treatment, the more meaningful question may be whether the new drug can do better than the existing treatment.
2. Does a smaller tumor count as efficacy?
Cancer-drug research offers an intuitive example.
Tumor shrinkage is visible and measurable. The objective response rate, or ORR, describes the proportion of patients in a study who achieve a predefined partial or complete response. [3]
“Response” here means that tumor shrinkage or disappearance meets the relevant requirements under the examinations and assessment criteria specified in the study.
A partial response means substantial shrinkage that falls short of a complete response. Under commonly used criteria for solid tumors, for example, the sum of the diameters of the target lesions selected for measurement must fall by at least 30% from baseline. There must also be no new lesions and no unequivocal progression of other lesions. Confirmation on a later assessment is required when specified by the protocol. [4]
A complete response means that no evidence of the tumor can be found using the specified assessment criteria. This still cannot be equated directly with cure: tests have detection limits, and the precise criteria differ between diseases. [5]
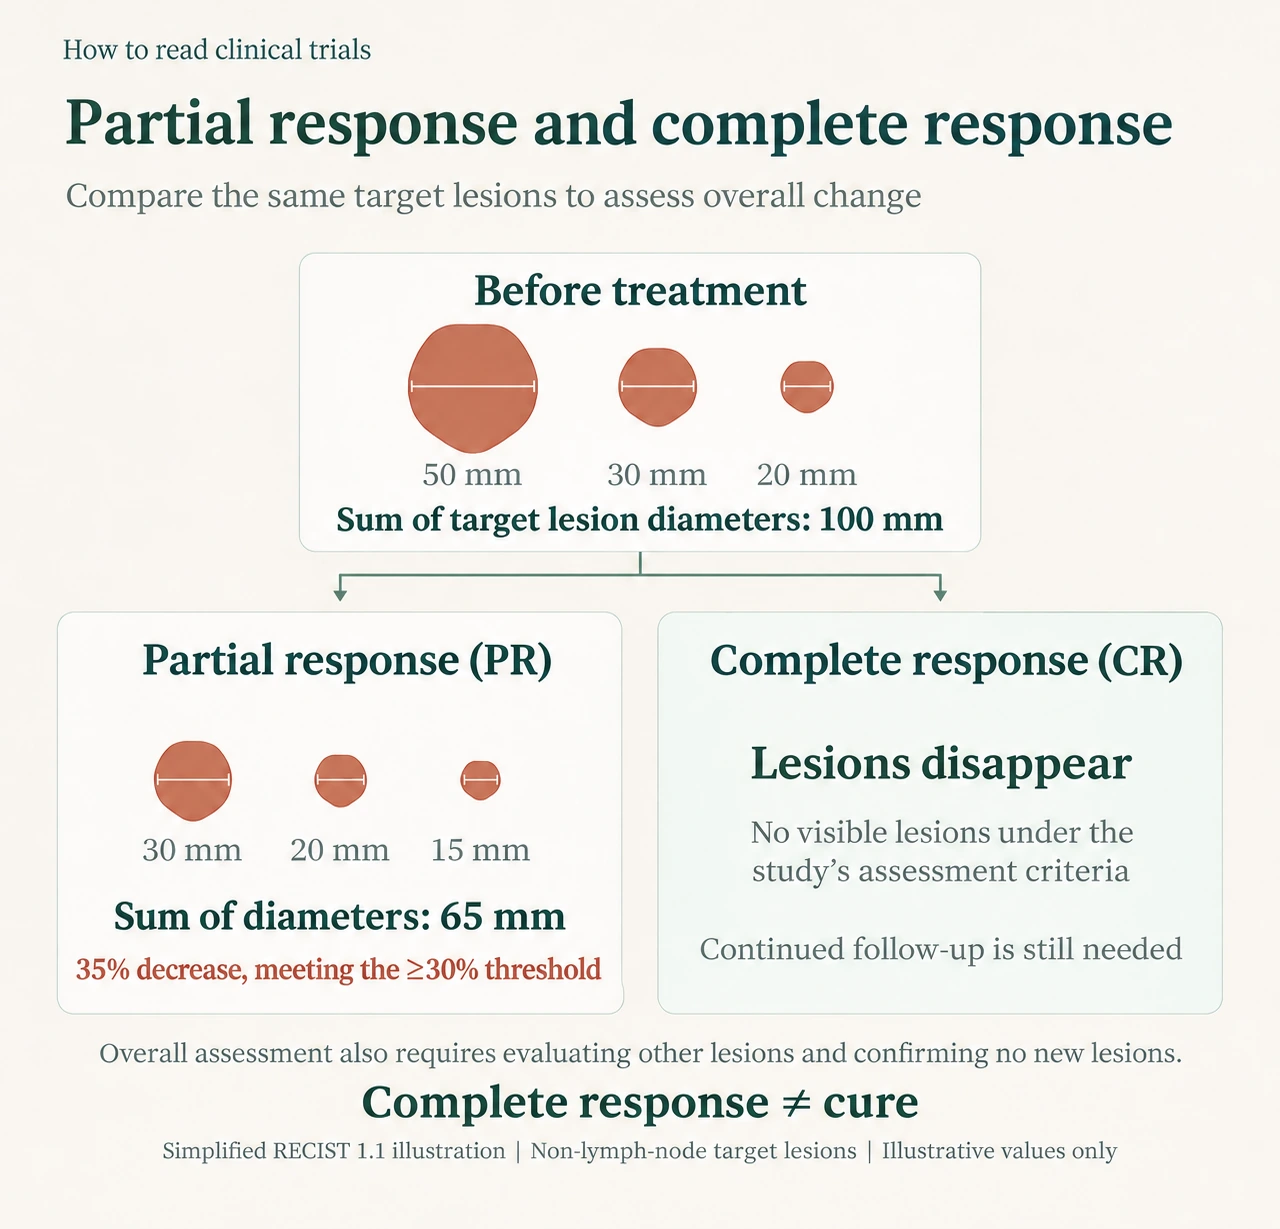
Figure: Comparing the sum of the diameters of the same set of target lesions. The illustration uses non-nodal lesions as an example. Overall response must also take account of non-target lesions, new lesions, and the study’s other specified conditions.
Image conceived and produced by Before the Conclusion. Please do not republish, copy, or use it commercially without permission.
But “how many people responded” does not tell us “how long the response lasted.” We therefore also need the duration of response, or DOR. It is generally measured from the first partial or complete response until progression or death, whichever occurs first, according to the study protocol. [6]
For example, a patient starts treatment on January 1, first achieves a partial response on March 1, with confirmation on a subsequent assessment, and is found to have a definite new liver metastasis on September 1, classified as progression under the study criteria. The duration of response is six months, from March 1 to September 1.
“Predefined” means that the study has already set out, before it begins, what counts as response, what counts as progression, and how the starting and ending times will be determined.
In its review of approval history, the FDA noted that anticancer drugs were often approved on the basis of ORR in the 1970s. By the early 1980s, greater emphasis was being placed on more direct clinical benefits, including survival, quality of life, physical function, and symptoms. [6]
Evaluating treatment therefore requires considering the patient as a whole. Do patients live longer? Is suffering reduced? Does their ability to manage daily life improve? Tumor shrinkage does not necessarily predict these changes.
Assessment standards evolve to make the changes observed in research correspond more reliably to the benefits patients actually receive. Research also needs objective criteria and appropriate comparisons to establish how much of an improvement comes from the drug itself.
Some benefits may be subtle, requiring sufficiently sensitive methods to avoid missing real, meaningful improvements. Side effects and treatment burdens also need careful recording. Getting good drugs to patients earlier requires assessing the costs patients may bear as well.
3. Are living longer and delaying progression the same answer?
Overall survival, or OS, measures how long patients live. In randomized trials, it is generally measured from random assignment to death from any cause. [7]
It directly addresses the survival question patients care about. Some diseases progress slowly, however, and sufficiently mature results may take a long time. Treatments patients receive later can also affect their ultimate survival. [6]
Progression-free survival, or PFS, measures how long patients remain alive without their disease progressing. It is generally measured from random assignment to progression or death, whichever occurs first. Unlike overall survival, which counts only death as an endpoint, PFS adds a further condition: during that time, the disease must also remain free of progression. A patient’s PFS therefore ends once the disease meets the study’s predefined progression criteria, even if the patient remains alive. [6,8]
“Disease progression” must itself be defined in advance, and the basis for judging it can differ between diseases.
Consider a patient with lung cancer. The sum of the diameters of the target lesions selected for measurement reaches its smallest value during treatment at 5 centimeters, then rises to 6.5 centimeters. That is an increase of 30%, calculated as (6.5 − 5) ÷ 5 × 100% = 30%, and an absolute increase of 1.5 centimeters, or 15 millimeters. Under commonly used solid-tumor criteria, this type of progression requires an increase of at least 20% relative to the smallest sum recorded during treatment, together with an absolute increase of at least 5 millimeters. This example meets both requirements. [4]
Another point needs explanation: does a tumor’s failure to keep shrinking mean treatment has failed? If changes in the lesions meet neither the criteria for partial response nor those for progression, and there are no new lesions or other unequivocal progression, the overall assessment may be stable disease. For some patients, maintaining stability for an extended period may itself be a valuable outcome. Stability, however, does not count toward the objective response rate described earlier. Nor can a single assessment of stable disease prove that the drug is working. Duration, control-group results, and the patient’s condition also matter. [4,6]
Why not count every small increase as progression? Imaging measurements contain error. Differences in scan planes, respiratory movement, and lesion boundaries can all produce small fluctuations. Requiring both a relative and an absolute increase makes the assessment more reliable and reduces the chance of mistaking measurement error for progression. Particularly when a lesion was small to begin with, a large percentage increase may amount to only one or two millimeters. [4]
Size on an image is also not identical to the number of living tumor cells. After treatment, a mass may contain both surviving tumor cells and cells that are dying. Its dimensions alone cannot tell us what has changed within it. [16] In immunotherapy studies, a small minority of patients also experience “pseudoprogression”: initial enlargement followed by shrinkage. Trials using the relevant immunotherapy assessment rules may repeat imaging, usually after 4 to 8 weeks, to confirm progression under conditions including clinical stability. This confirmation assessment is distinct from the growth thresholds used to reduce measurement error. A suspicion of inflammation or necrosis alone is not enough to interpret lesion enlargement as evidence that treatment is working. [15]
As another example, researchers can monitor a patient with multiple myeloma through an abnormal protein in the blood called M protein. A rise from its lowest level after treatment that meets the specified threshold and is confirmed on repeat testing can also be classified as progression. New pain does not necessarily have to appear first. [9]
Studies therefore need to define their assessment rules in advance using the disease’s characteristics and recognized standards, so that different hospitals and treatment groups use the same rules. Researchers cannot change these rules at will, still less redraw the boundaries after seeing the results to obtain a more favorable conclusion. Changes genuinely required by new scientific evidence or safety concerns should be made through a formal protocol amendment, with reasons given and the required ethics review and any necessary regulatory procedures completed. Key analytical methods should be settled before unblinding or learning the between-group results. Additional analyses performed after results are available must be identified honestly as post hoc. [17–19]
Delaying progression may be highly valuable. But a delay seen on imaging and an improvement patients can feel do not necessarily occur together.
A patient with lung cancer, for example, may have several consecutive CT scans showing stable lesions, while persistent treatment-related fatigue and nausea destroy their appetite and make their usual daily walk difficult. Imaging shows disease control, yet the patient may not find life any easier. Symptoms and everyday functioning require evidence of their own. [10]
4. If outcomes require judgment, who makes that judgment matters
Selecting lesions, measuring them, and interpreting the results require shared rules.
RECIST stands for Response Evaluation Criteria in Solid Tumors. Experts from organizations including the European Organisation for Research and Treatment of Cancer, the U.S. National Cancer Institute, and what was then the National Cancer Institute of Canada Clinical Trials Group developed the criteria together. The first version appeared in 2000; the 2009 revision was RECIST 1.1. [4,11]
For example, a patient with lung cancer has multiple lesions in the lungs and liver. Following the criteria, researchers choose clearly measurable, representative lesions that can be measured repeatedly as target lesions: up to 5 throughout the body and no more than 2 in each organ. Other lesions must also be recorded and monitored.
If they select one lung lesion and one liver lesion, they measure each lesion’s longest diameter on CT and add them. The pretreatment sum is 100 millimeters. On reassessment, the same lesions measure 65 millimeters in total, a reduction of 35%.
This meets the shrinkage threshold for partial response described above. But if the same scan also reveals a definite new bone metastasis, the overall assessment is still progression. The measurements must be interpreted alongside the other lesions and any new lesions. [4]
Shared rules must be accompanied by efforts to minimize the influence of assessors’ expectations.
This is the role of blinded independent central review: professionals independent of the treatment team reassess imaging using uniform rules.
A patient may, for example, receive treatment and undergo CT scans at Hospital A, with the images then sent to a separate independent imaging-review organization. The reviewers do not treat the patient and do not know whether the patient received the new drug or the control treatment. They assess response against predefined standards. The essential meaning of “independent” is that the personnel and review process are independent of the treatment team; it does not impose an absolute requirement that they be located at another hospital. [6]
Independent review nevertheless has limits.
Suppose the control group undergoes CT every 4 weeks and the new-drug group every 8 weeks. Two patients actually meet progression criteria at week 3. Progression is detected in the control patient at week 4 but in the new-drug patient only at week 8. If the date of first imaging confirmation is used, the latter may appear to have 4 extra weeks free of progression, even though the difference came from the scanning schedule.
Having the same independent team read the scans cannot eliminate that effect. If a scan is missed, or imaging follow-up stops after treatment is discontinued, reviewers also cannot determine from the available images alone whether progression occurred during the gap. The assessment schedules in both groups, continued follow-up, and the handling of missing data therefore remain important. [6]
5. Once an endpoint is chosen, the method of comparison still matters
OS and PFS describe the outcomes a study intends to observe. The next question is whether the rate of the relevant events differs between the new-drug and control groups. The hazard ratio, or HR, is a statistical measure commonly used for this comparison. [13]
In 1972, statistician David Cox published a classic paper on survival-time analysis, introducing what became the widely used proportional hazards model. Building on existing survival analysis, it provided an important way to bring factors such as treatment, age, and disease severity into the same analytical framework. [12]
In a trial, for instance, one patient progresses after three months. Another remains progression-free after eight months of follow-up. A third enrolled later and has so far been observed for only two months. The latter two patients still supply information: at least during the period for which they were reliably observed, they had not experienced the relevant event.
When its assumptions are met, the model can use event times and this follow-up information to compare hazards in the two groups while adjusting for recorded factors such as age and pretreatment disease severity. It cannot automatically fill in missing information. If patients whose condition worsens are more likely to be lost to follow-up, bias may remain.
Understanding HR first requires understanding “hazard.” At a given moment, it concerns the rate at which patients who have not yet experienced the relevant event will experience it over the next extremely short interval. This is the instantaneous hazard, and HR compares this rate between the two groups. [12,13]
To picture “instantaneous,” pause the film of follow-up at month six. For PFS, consider only those in each group who are still alive, have not progressed, and remain under follow-up. Compare the speed at which they experience progression or death over the next extremely short interval.
An HR of 0.70 at that point means that the event rate in the new-drug group is approximately 70% of the control group’s rate at that time. Formal studies usually estimate an HR using follow-up information as a whole. It is not a ratio of the cumulative probabilities of an event within one year. Nor can it be translated directly into “every patient lives 30% longer.” If the relationship between the two groups’ hazards changes substantially over time, a single summary number may also fail to describe the whole course. [12,13]
We must also ask which event the number refers to. PFS combines progression and death into a composite endpoint, using whichever happens first. An improvement in the PFS HR therefore cannot be treated as proof of an improvement in OS.
Next, translate the relative measure into concrete differences. One number commonly reported is median PFS.
“Median” has its usual statistical meaning. Imagine arranging every patient’s PFS from shortest to longest and finding the middle. If the PFS of 5 patients has been fully observed and the values are 3, 6, 12, 18, and 24 months, the middle value, 12 months, is their median PFS.
Real trials are more complicated. At the analysis date, some patients have not yet progressed and their follow-up is ongoing. Their follow-up duration cannot simply be treated as a complete PFS value and placed in that line. Studies generally use survival-analysis methods to estimate, from available follow-up information, how the proportion of patients remaining alive and progression-free changes over time. The time when this estimated curve reaches or crosses 50% is the median PFS usually reported. If the curve has not fallen to that level, median PFS may be described as “not reached.” [20]
Suppose median PFS is 12 months in the control group and 18 months in the new-drug group, a difference of 6 months. This describes the difference between the groups at that middle position. It does not mean everyone gained 6 months.
We can also choose a common time point. If the estimated proportion experiencing progression or death within one year after randomization is 50% in the control group and 40% in the new-drug group, the absolute difference is 10 percentage points. This corresponds to approximately 10 fewer patients per 100 experiencing these events within that year.
These months and proportions tell us how large the difference is. They must be read alongside uncertainty in the estimates and the maturity of follow-up. Drugs cannot be ranked directly using only HRs or medians from different trials.
If a study measures many outcomes, it also cannot simply select the most attractive result afterward. The primary endpoint, secondary endpoints, and methods for controlling the risk of false conclusions across multiple comparisons all require advance planning. [14]
We can now distinguish what a study observes, how it makes its assessments, and how large the difference between groups is.
One practical difficulty remains: obtaining these answers takes time. For diseases with a long course, sufficiently mature OS—and even PFS—results may take years. Research needs reliable efficacy and safety evidence to accumulate. Patients whose disease keeps worsening and who lack effective treatment may not have that long to wait. If a drug with a real benefit is delayed, some may lose the opportunity to receive it while waiting.
Is there a way to give patients earlier access to potentially effective treatment before the final outcomes are completely clear? Medical research and drug development continually face this challenge: making evidence-based judgments that account for the reliability of the evidence, unresolved safety questions, and the time patients must spend waiting.
This is why researchers keep seeking changes that appear earlier and have a scientific basis, and testing whether they can serve as surrogate endpoints to help predict future clinical benefit. In appropriate disease and treatment settings, such evidence may support earlier approval, while further studies are still required to verify the expected benefit and add long-term efficacy and safety information. [6,21]
How much can reduced urine protein, no detectable residual tumor cells in bone marrow, or even the disappearance of tumor DNA from blood tell us in advance? Which signals already have substantial supporting evidence, and which still require validation?
In the next article, “Do more sensitive measurements necessarily mean patients benefit?”, we continue from here, examining how earlier signals become evidence and how patients’ experiences, treatment costs, and long-term risks enter that judgment.
Beyond the conclusion, there are still questions worth asking.
Medicine · Science · Ideas and reading
Follow Before the Conclusion as we stay curious and think independently together.
About the examples: Apart from real studies with identified sources, the patient cases, dates, and illustrative numbers in this article are teaching examples. They do not represent specific patients or real clinical-trial results, and do not describe an actual disease course. Any resemblance is coincidental.
This article discusses medical and scientific knowledge and does not replace individual medical advice.
Text and image use
The original text was written by Before the Conclusion, which also conceived and produced the illustration. You are welcome to share this article’s web link. Unless separately authorized, please do not republish or excerpt the text by copying, reposting, or distributing screenshots, use the illustration separately, or use either for commercial purposes.
Main sources
Medical Research Council. Streptomycin treatment of pulmonary tuberculosis. BMJ, 1948. Original report; Searchable full text. Used to check randomization, six-month outcomes, baseline comparability, and resistance.
FDA. Promoting Safe & Effective Drugs for 100 Years. Used to check the 1962 amendments.
NCI. Objective response rate.
Eisenhauer et al. RECIST 1.1, 2009. Original guideline; Working-group explanation.
NCI. Complete response.
FDA. Clinical Trial Endpoints for the Approval of Cancer Drugs and Biologics, final guidance, 2018. Used to check approval history, DOR, OS/PFS, independent review, scanning schedules, and missing data.
NCI. Overall survival. Source 6 was also used for the specific starting point in randomized trials.
IMWG. Uniform response criteria.
FDA. Core Patient-Reported Outcomes in Cancer Clinical Trials, final guidance, 2024.
RECIST Working Group. Terms of Reference; Therasse et al. Original 2000 guideline.
Cox DR. Regression Models and Life-Tables, 1972; Paper copy.
FDA. Approaches to Assessment of Overall Survival in Oncology Clinical Trials, draft guidance, August 2025; NCI. Hazard ratio.
FDA. Multiple Endpoints in Clinical Trials, final guidance, 2022.
Seymour et al. iRECIST: guidelines for response criteria for use in trials testing immunotherapeutics, Lancet Oncology, 2017. Used to check pseudoprogression, the condition of clinical stability, and confirmation after 4 to 8 weeks. These criteria apply to the relevant clinical trials and should not be generalized into management rules for every treatment.
NCI. Responses to Cancer Therapies are Complex, 2018. Used to check that mass size does not have a one-to-one correspondence with the composition of living and dying cells.
FDA/ICH. E8(R1) General Considerations for Clinical Studies, section 5.6; E9 Statistical Principles for Clinical Trials, section 5.1. Used to check prespecified analyses, blinded review, finalizing the analysis plan before unblinding, and documentation of changes.
FDA. Institutional Review Boards Frequently Asked Questions, question 45. Used to check ethics review of protocol amendments. Emergency changes to eliminate immediate hazards to participants have corresponding exception procedures.
CONSORT 2025. Item 10: Changes to trial protocol. Used to check the need to explain important changes after a trial begins and endpoints and analyses that were not prespecified.
StatsDirect. Kaplan-Meier Survival Estimates. Used to check censored follow-up information, survival curves, and estimation of median times. The line-up example in the text applies only to the simplified case in which every patient’s PFS has been fully observed.
FDA. Surrogate Endpoint Resources for Drug and Biologic Development. Used to check the uses of surrogate endpoints, disease and treatment context, and their relationship to traditional approval and accelerated approval.
Continue to part two: Do more sensitive measurements necessarily mean patients benefit? →