1. A small ball, and a picture of life
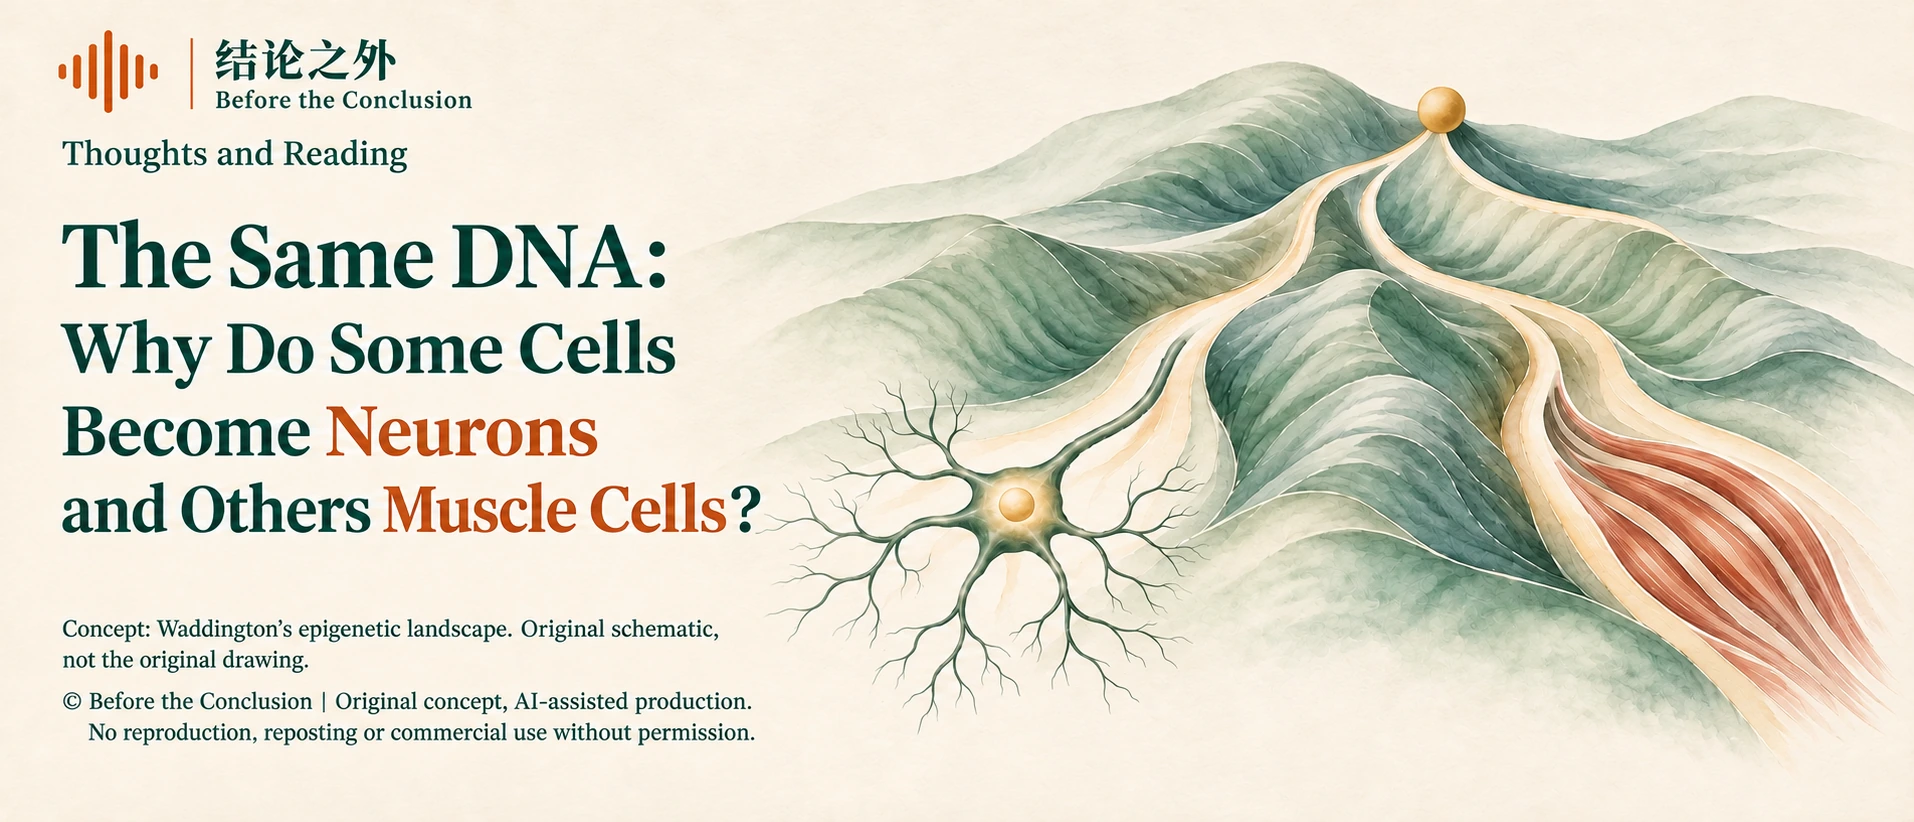
A small ball rests on a hillside. Below it lies no broad, level road, only a series of valleys that gradually branch apart. Farther down, the ridges between the valleys grow higher, and the routes open to the ball become increasingly limited. Along one route, it will become a nerve cell; along another, it may become a muscle cell, or some other cell in the body.
This is no geographical diagram. It is a celebrated image bequeathed to biology by the British developmental biologist Conrad Waddington, usually called the “epigenetic landscape.” The idea gradually took shape in the first half of the 20th century. In 1957, Waddington presented the version that would become widely known in The Strategy of the Genes.2
The picture is simple, but the question is astonishingly large: how does a fertilized egg gradually form a body with nerves, muscles, blood, and skin?
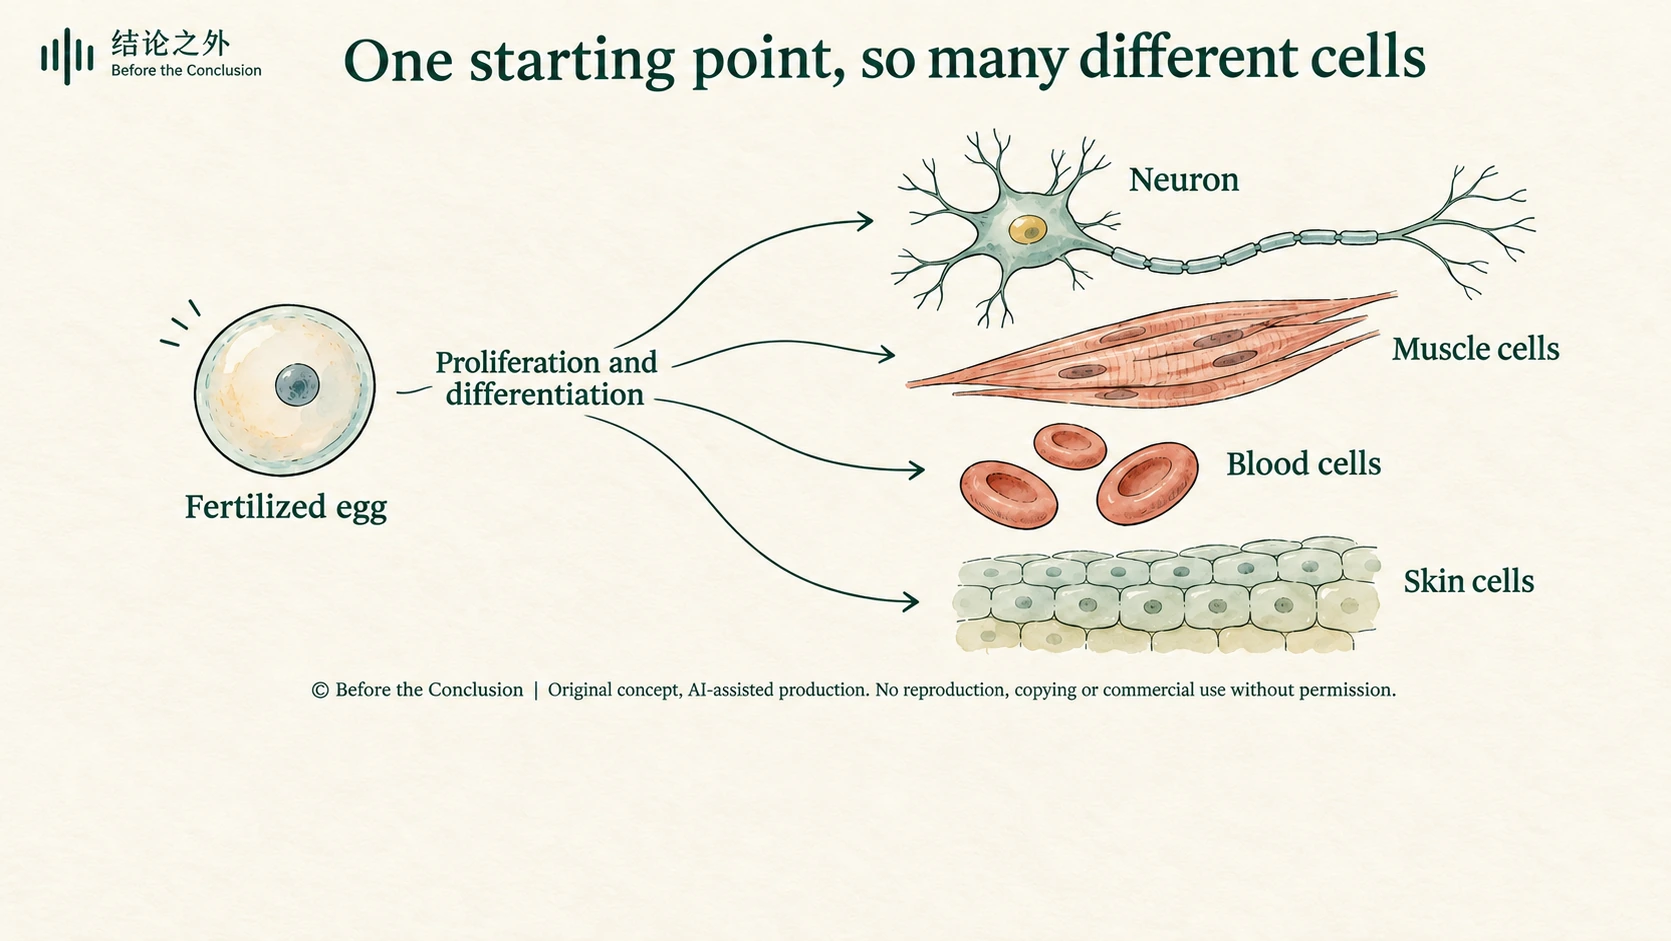
Today, we are accustomed to explaining life through DNA. It stores hereditary information, helps determine how organisms grow, and influences the risk of many diseases. But shift your gaze from differences between people to the inside of a single person's body, and a less easily answered question appears: nerve cells and muscle cells carry largely the same genetic information, so why are their shapes, functions, and ways of living so different?
On October 9, 2026, science writer Philip Ball returned to this picture in an article in Quanta Magazine. Single-cell technologies and mathematical models are bringing this old metaphor into the realm of experimental testing.[1] Yet what deserves examination includes both what the picture can at last explain and how we must revise it when the data become rich enough.
A small ball can help us enter the question. Next, we have to walk around to the back of the picture.
2. Does becoming one kind of cell mean losing the other possibilities?
Let us begin by imagining an explanation: might cells discard genetic information they do not need as they differentiate?
A muscle cell keeps the parts for making muscle; a nerve cell keeps the parts for making nerves. The division of labor would then be easy to understand. Each cell retains its own share, and everyone does their allotted job.
Classic experiments tell us that this is not what happens.
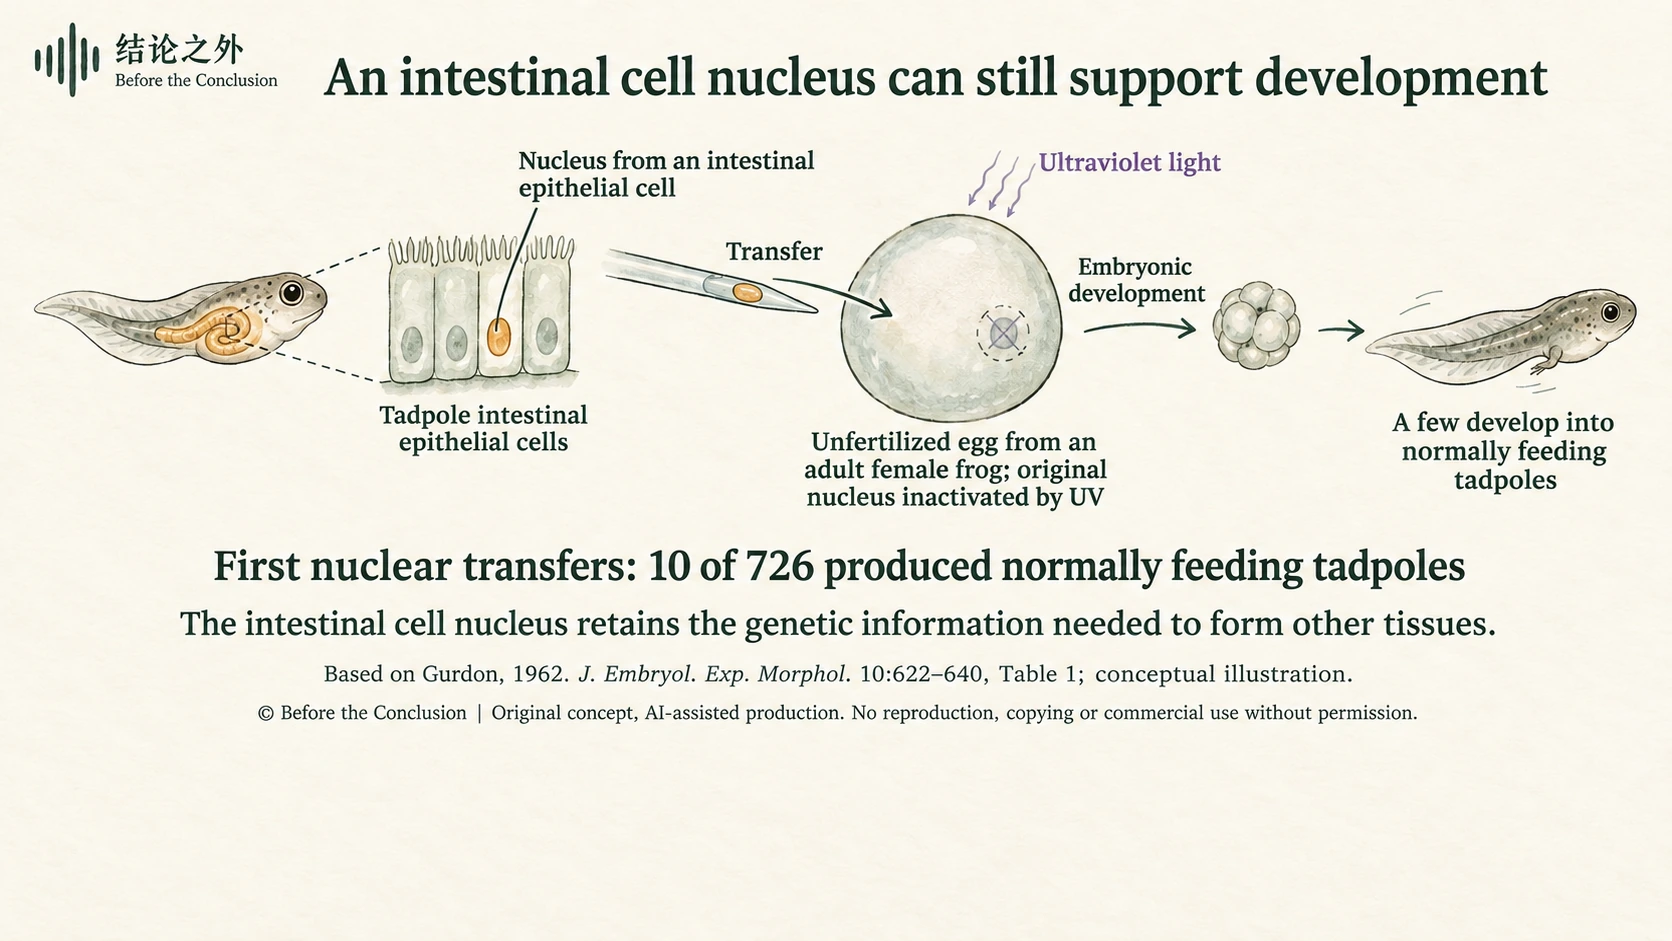
In 1962, John Gurdon reported his research on nuclear transplantation in frogs. He took nuclei from differentiated intestinal epithelial cells of tadpoles and transferred them into eggs whose original nuclei had been removed or inactivated. Some of these nuclei could support the development of new tadpoles. A nucleus that had served the intestine still retained the genetic information needed to form other tissues.[3]
The finding turned the question in a new direction. We cannot simply understand the specialization of an intestinal cell as its having deleted everything required to become other kinds of cells. A substantial range of possibilities remains in the genetic information; it is simply not called upon under ordinary conditions.
For the great majority of nucleated somatic cells in the same person, differentiation chiefly depends on how this information is used: which genes are transcribed, how active they are, which proteins they produce, and how those products influence subsequent activity.
We often sum this up by saying that “different cells switch on different genes.” That is useful, but it can also make the question seem settled. Why is this particular group switched on? What maintains the combination? After the signal that originally initiated differentiation has disappeared, why can the cell still retain its identity?
If our answer is merely “because muscle cells switch on muscle genes,” we have really just restated the original question in language that sounds more technical.
The same DNA permits different cellular identities. What we need to explain is how those identities arise and how they are maintained.
© Before the Conclusion | Original concept; AI-assisted illustration. No republication, copying, modification, or commercial use without permission.
3. What is hidden beneath Waddington's picture?
Alongside the famous landscape, Waddington drew another picture: a view of the undulating ground from below.
The surface resembles a flexible sheet being pulled in different directions. Many cords attach to its underside and run to fixed pegs. The pegs represent genes; the cords symbolize the chemical effects those genes produce. Their intertwined pulls shape the valleys above. Change a pull in one place, and the entire terrain may be affected.2
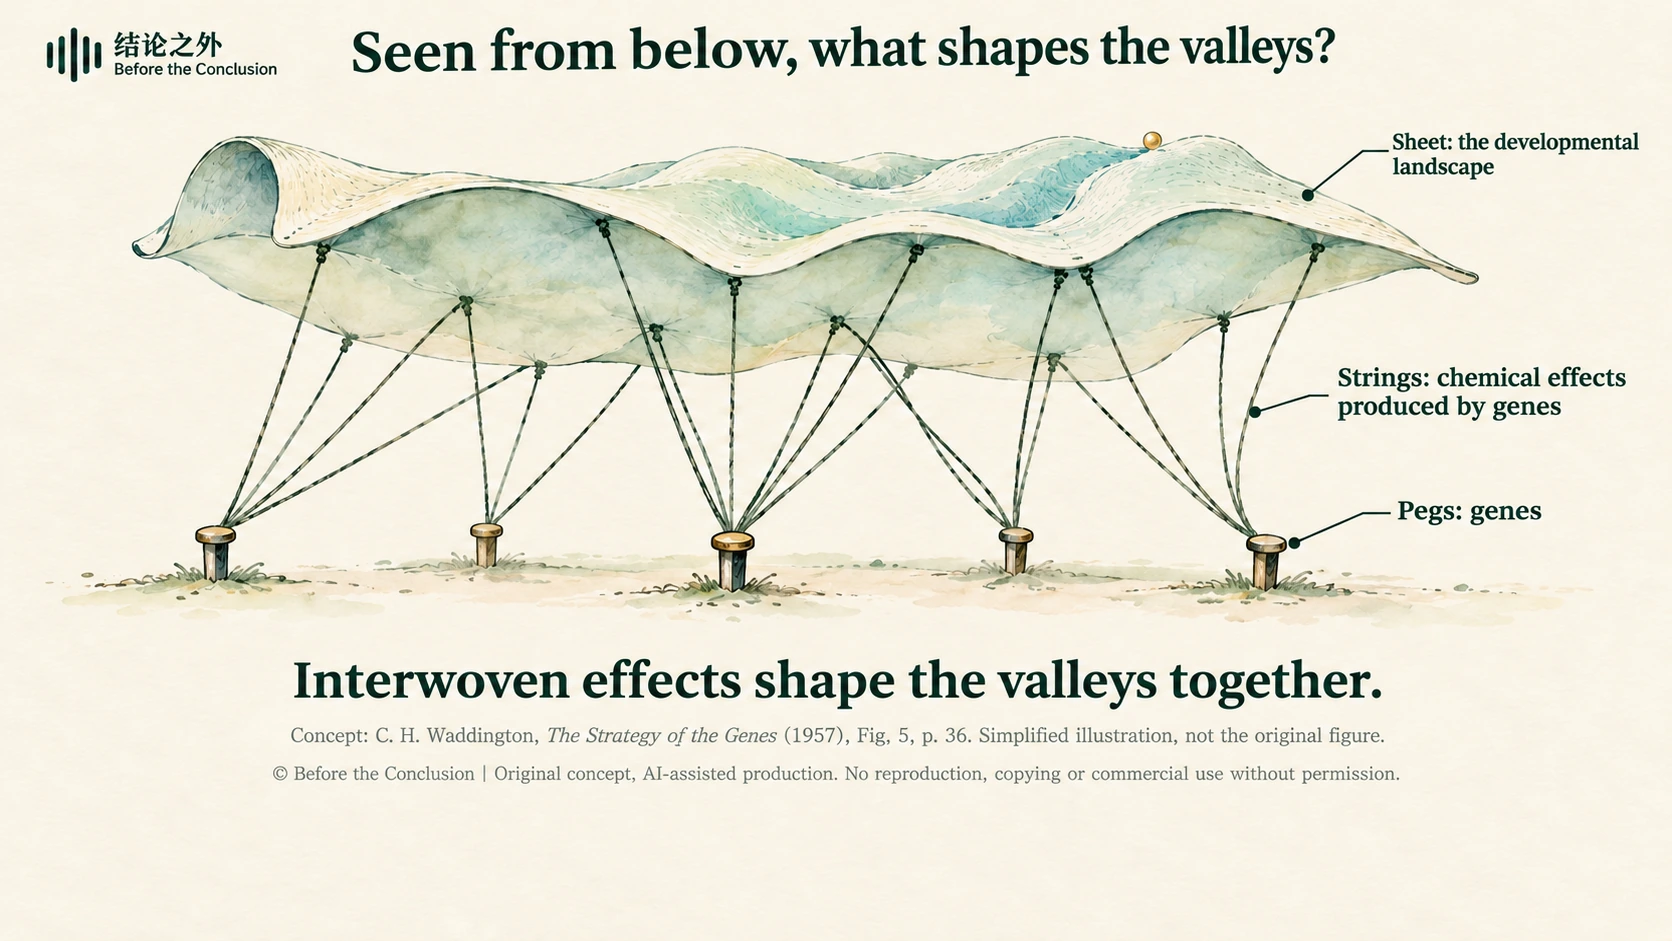
This view from below reminds us that explaining cell differentiation requires us to consider relationships among many components. As early as 1942, Waddington proposed that a whole interconnected set of developmental processes lies between an organism's inherited genetic constitution and its eventual form and traits. What we need to explain is precisely how genetic factors act through those processes to produce observable outcomes, step by step.[4]
In today's language, the genetic information carried by DNA becomes embodied in the body's form and function through specific cellular activities. Which genes act, when and where they act, how cells divide and move, how they signal to one another, and how they form tissues and organs are all part of that process. Once we know “which genes are there,” we still need to ask how their activities connect during development.
Researchers now use “gene regulatory networks” to describe an important part of this. Proteins produced by some genes promote the expression of other genes; others suppress it. The affected genes may, in turn, alter the original regulators. Mutual activation, mutual inhibition, and feedback allow some combinations of activity to become established while making others difficult to sustain.
This does not mean that every gene is equally important. Sometimes, a small number of regulatory factors can change activity across a large part of a network. Fibroblasts mainly help form and repair connective tissue and do not normally differentiate along a muscle pathway on their own. In 1987, researchers introduced and expressed a regulatory factor later called MyoD in a type of cultured mouse fibroblast, converting cells into myoblasts: precursor cells capable of forming muscle.[5]
It is tempting to sum up this finding as “the muscle switch has been found.” MyoD is a protein that regulates the expression of other genes. Under suitable conditions, it can activate a group of muscle-related genes and their subsequent activities, pushing cells toward muscle differentiation. This “switch” works through the entire “circuit” it can bring into action. A regulatory factor's effect also depends on the cellular context it enters.
An everyday scene may help make sense of that “context.” Imagine two rooms lit by the same white light. One has red wallpaper, the other green wallpaper. Once illuminated, the rooms naturally look different. The effect of the light also depends on the colors and furnishings already in the room.
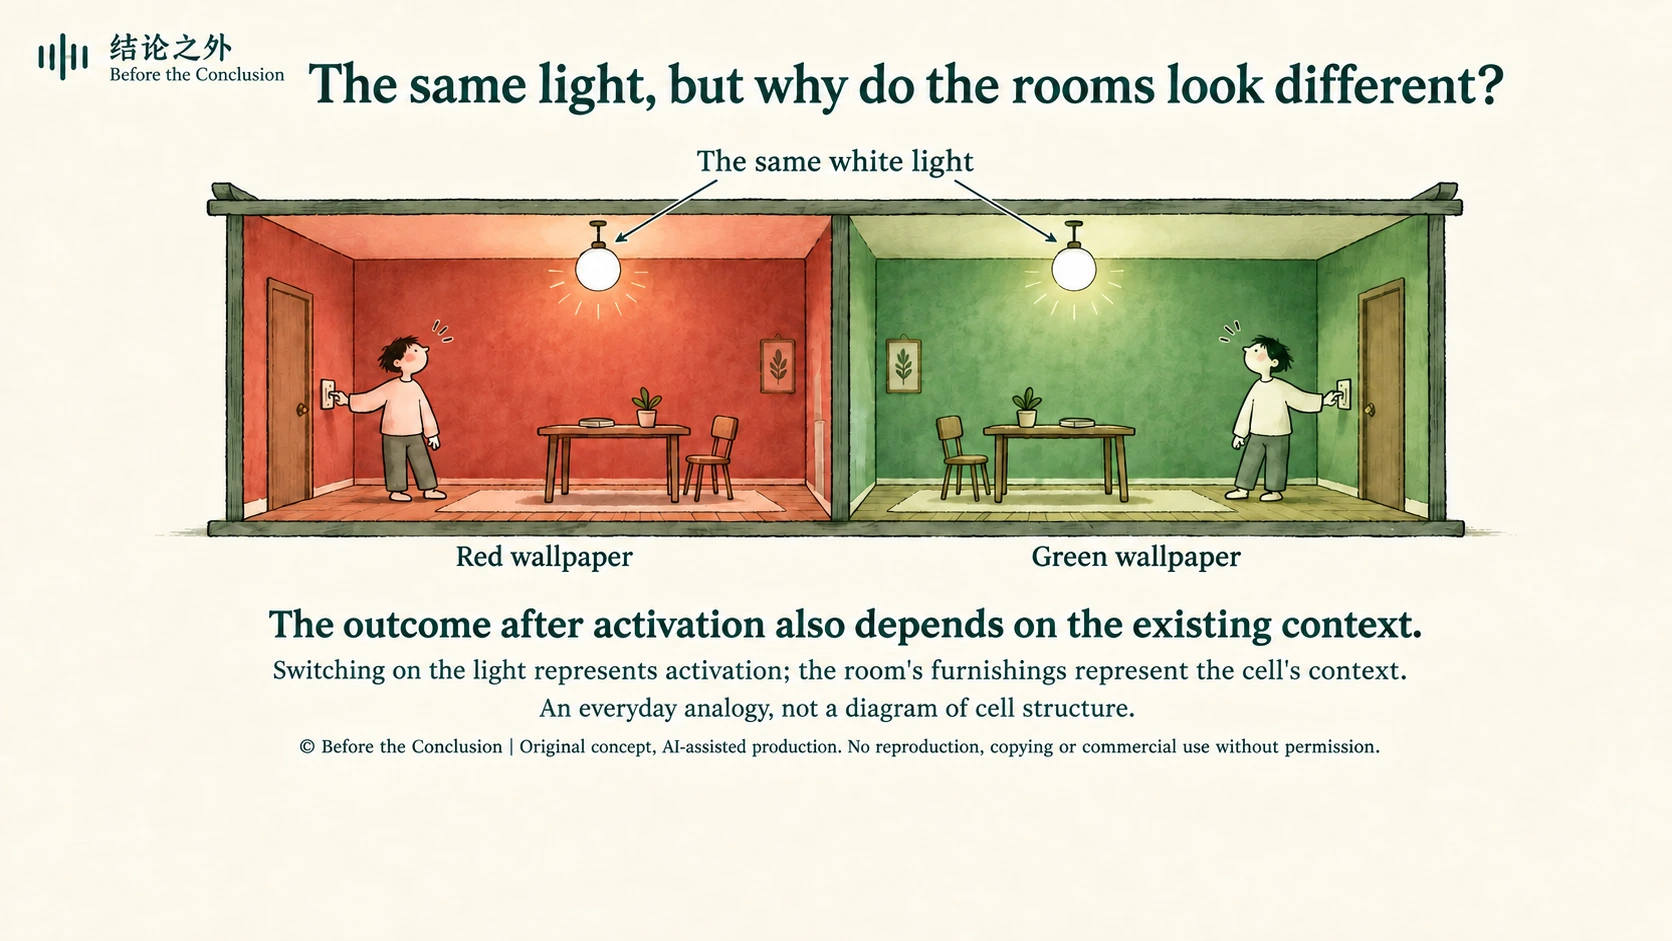
A cell's “context” includes which gene regions are accessible, which regulatory proteins are already present, and what signals it has received before. These conditions influence which responses a given regulatory factor can initiate and whether those responses can continue. Regulatory factors can also change the cell's existing state, however, making their role more active than simply “lighting a room.”[5]
These regulatory processes matter to patients, too
Similar regulation of gene expression also appears in patients' pathology reports and drug treatments.
The estrogen receptor (ER) listed in breast cancer pathology reports is a protein that can regulate gene expression. In some ER-positive breast cancers, tamoxifen interferes with the receptor's action to inhibit estrogen-driven tumor growth. The same drug has different effects in tissues such as the breast and bone, reminding us again that a regulatory protein's cellular context matters.[14]
In the treatment of type 2 diabetes, the target of pioglitazone, PPARγ, is also a protein that regulates gene expression. By activating it, the drug affects the expression of genes involved in glucose and lipid metabolism and helps improve the body's response to insulin.[15]
Another protein, p53, often called the “guardian of the genome,” helps mobilize responses such as cell-cycle arrest, repair, and apoptosis when DNA is damaged. Mutations in the TP53 gene in many tumors impair p53's tumor-suppressing function, making it easier for abnormal cells to continue proliferating.[16]
These examples show that gene-expression regulation concerns both what a cell becomes and how it grows, responds to damage, and handles nutrients.
The cords in Waddington's picture therefore deserve a closer look, alongside the individual pegs. We need to know which genes are present, how they connect, and under what conditions they act.
4. Why do cells not decide who they are all over again each day?
The interior of a cell is far from quiet. Molecules are continually produced and broken down, and measured gene-expression levels fluctuate. If every small fluctuation could change cellular identity, our bodies would have a hard time functioning.
Imagine an absurd scene: you are holding a dumbbell when the muscle cells in your arm suddenly announce, “I'm hungry. I'll become an intestinal cell instead!” Whether you can continue lifting might then depend on your cells' impromptu “career plans.”
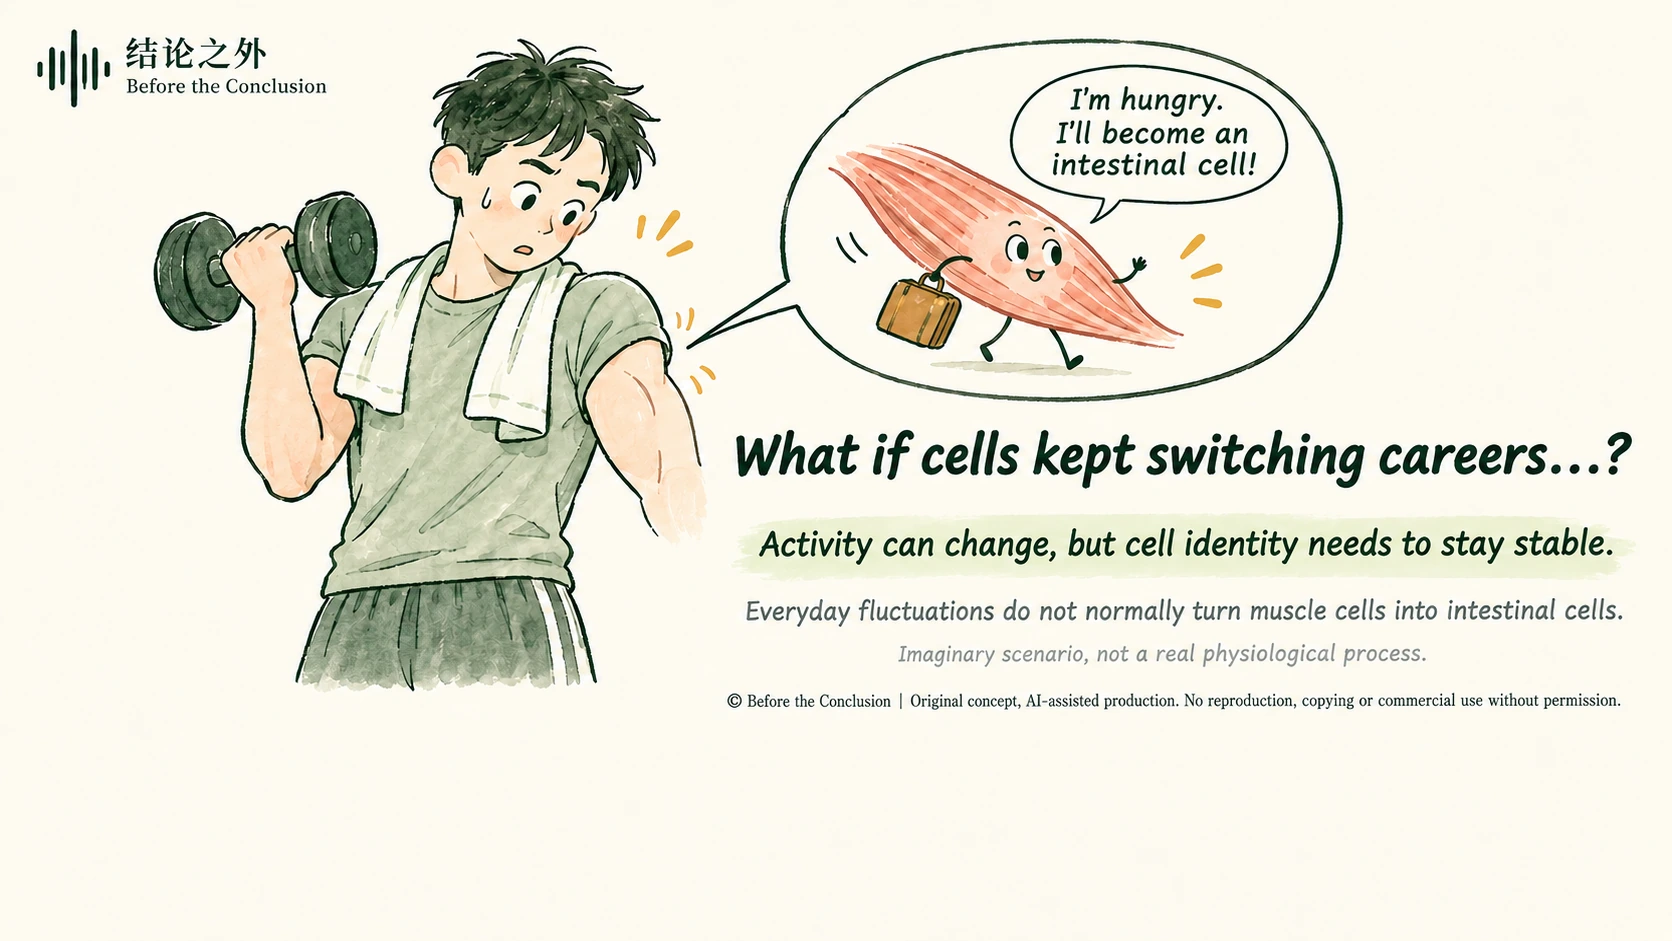
In reality, hunger and exercise prompt muscle cells to adjust their metabolism and working state without readily turning them into intestinal cells. Stable cellular identity allows them to keep doing their original jobs as conditions change. What we need to explain is how that stability is maintained amid continual molecular fluctuations.
This is where the landscape metaphor shows its power.
A ball near the bottom of a valley does not necessarily cross a ridge when slightly disturbed. It may briefly move away, then return to its original region. Mathematicians call a stable state toward which a system tends under certain conditions an “attractor.” In one class of cell-differentiation models, such an attractor can describe a relatively stable cellular state.[6]
This gives “stability” a more precise meaning: local changes are possible while the overall state persists. A cell does not need to hold the number of every molecule perfectly still in order to retain its basic identity.
Research on nervous-system development offers a concrete example. In 2012, a study combining mouse experiments with mathematical models found that, as neural tube cells respond to a signal called Sonic Hedgehog, the downstream regulatory network can buffer signal fluctuations and retain a “memory” of earlier signaling. Both the strength and duration of the signal influence the cells' eventual response.[7]
“Memory” here does not imply consciousness. It means that a system's response is affected by its previous experience. The same external input may produce different results in cells with different histories.
We can now see more clearly why “having the same DNA” does not mean that cells have the same possibilities at every moment. Alongside genetic information, active regulatory relationships and processes already experienced also constitute a cell's current state.
Imagine a classroom full of sixteen-year-old students. They are about the same age, listening to the same teacher, and all appear attentive. Yet one is thinking about the person they hope to become; another is full of ambition; another is dissatisfied with school life; and another worries about the future. A setback yesterday, a long-standing interest, or a remark just heard may all help make up each person's present state. Their common age and similar classroom circumstances are far from enough to explain how they will respond to the next question.
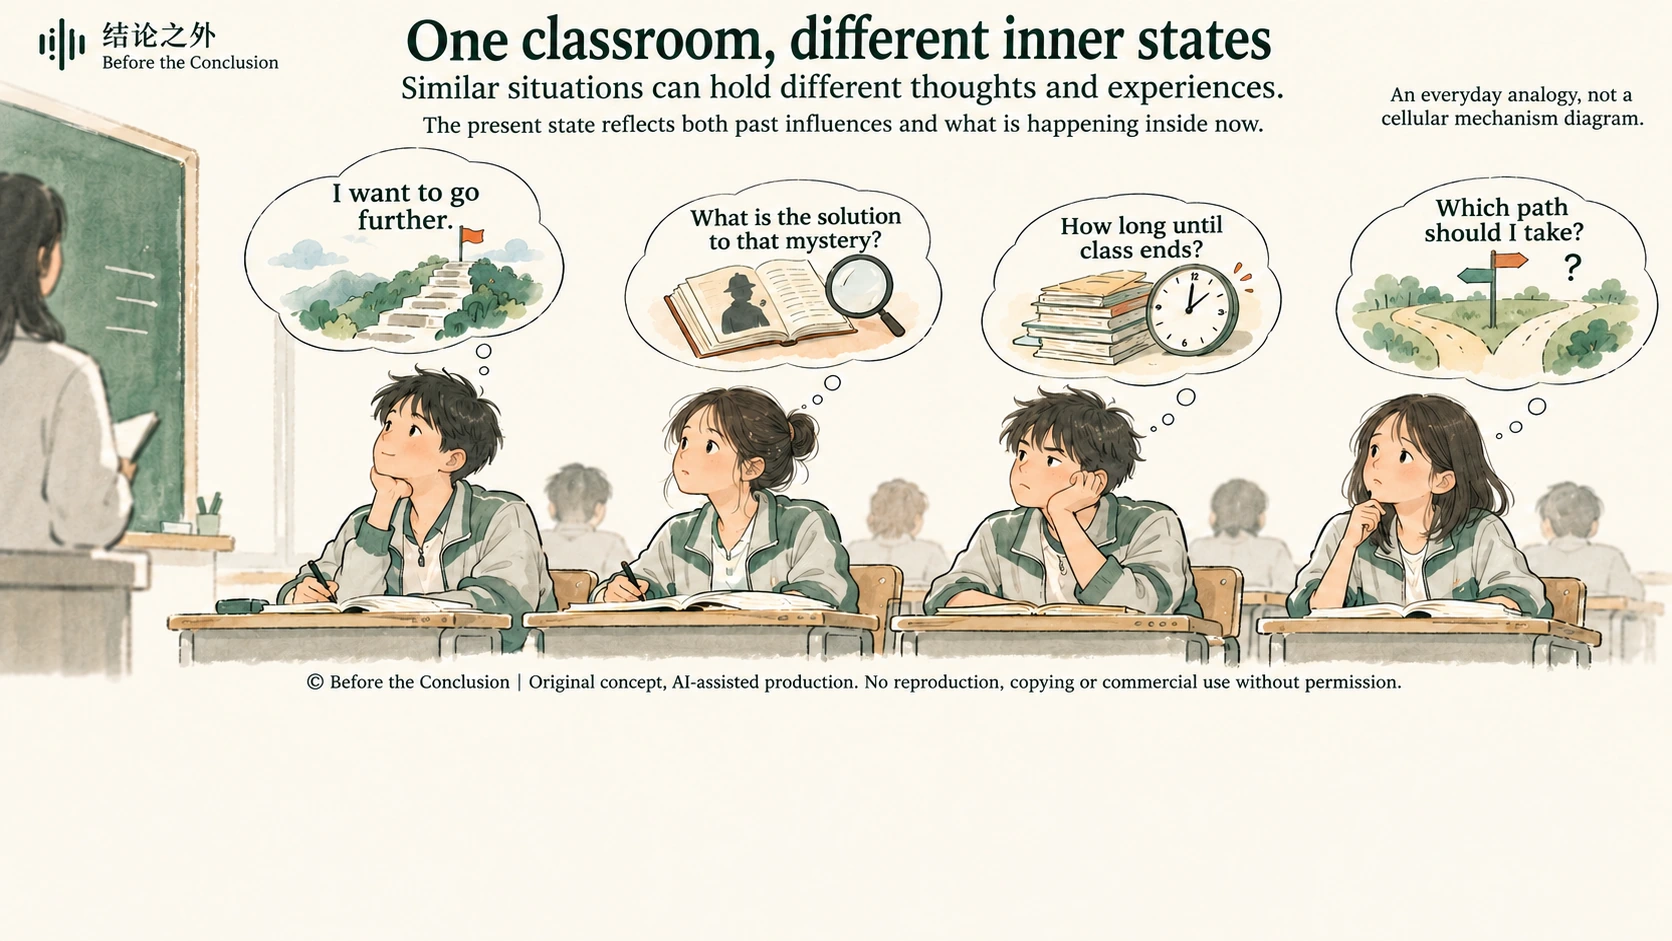
Returning to cells, the lasting effects of earlier signals and development combine with active regulatory relationships to shape their response to the next signal.
5. Can we finally measure this landscape?
When Waddington drew his pictures, scientists could not read molecular activity in large numbers of individual cells at once. Today, single-cell RNA sequencing allows researchers to compare RNA levels corresponding to many genes in different cells and use them to map differences among those cells.
But the data produced by an experiment are not a ready-made map of valleys.
Each cell may have thousands or tens of thousands of measured values. To identify structure and display the results, researchers must select variables, perform calculations, and project complex data into fewer dimensions. The clusters of colored dots readers see are often the product of that processing. Two groups lying close together on a chart, or a line connecting them, does not by itself establish that cells actually traveled that route.
There is another, more easily overlooked difficulty: conventional single-cell RNA sequencing usually requires cells to be lysed. Researchers obtain snapshots of many cells in different states. After taking the measurement, they cannot follow the same cell to see where it goes tomorrow.
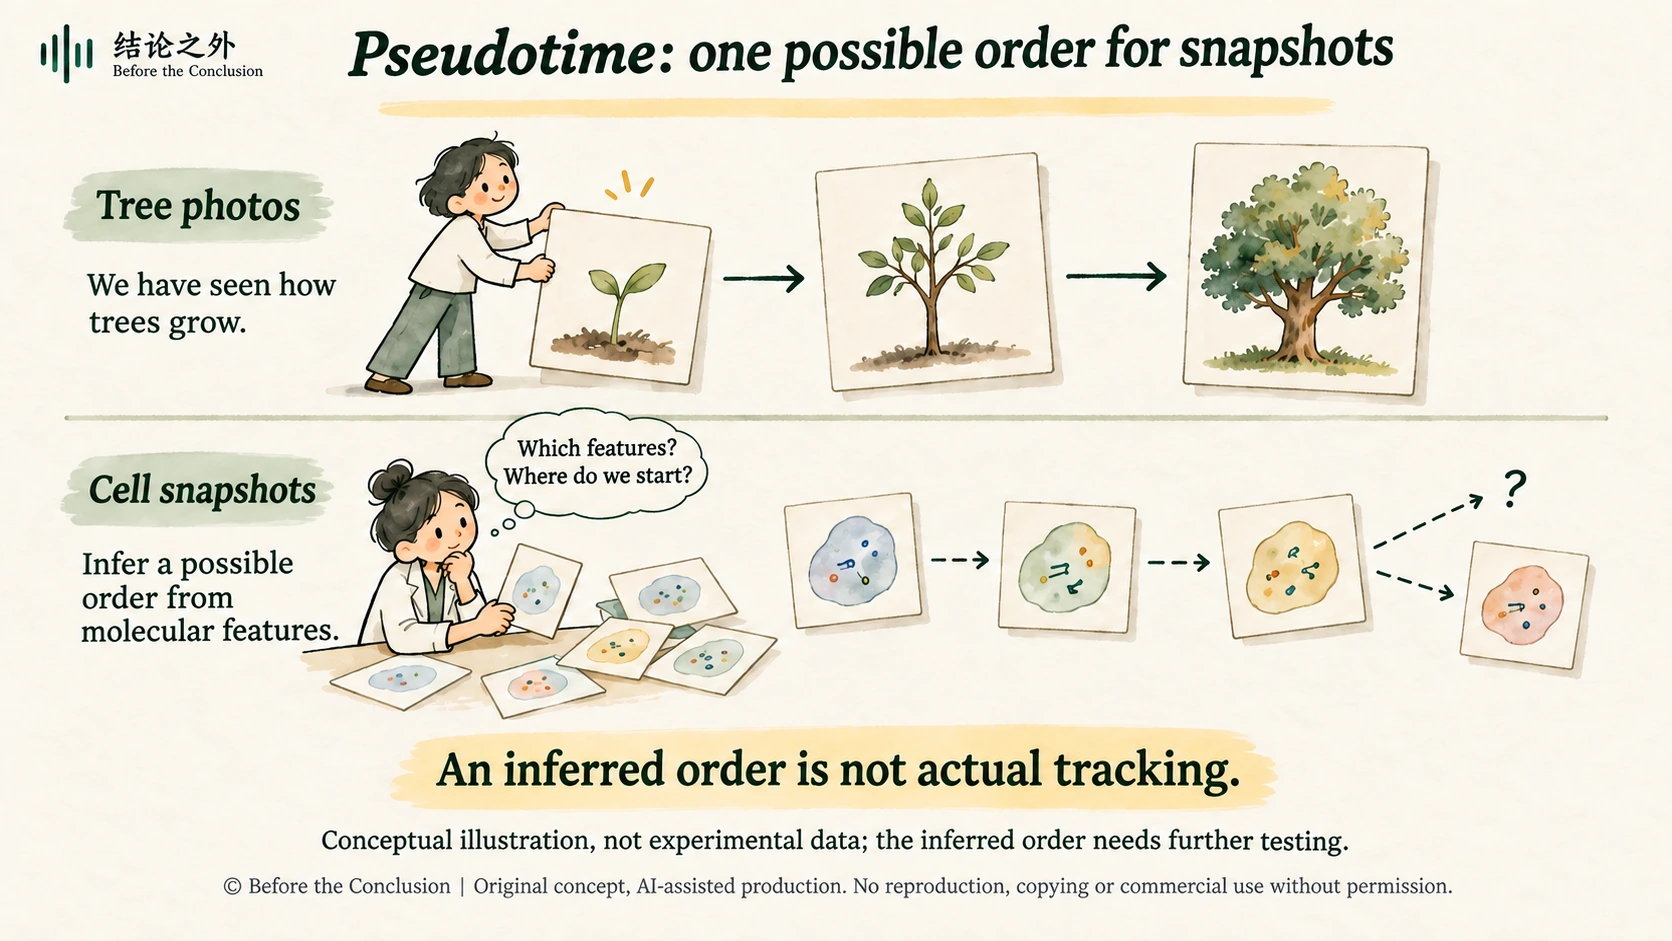
One approach is to infer a possible sequence from molecular differences between cells. Monocle, a method introduced in 2014, attempted to infer differentiation trajectories using this kind of “pseudotime.”[8]
It is a little like a sorting game: given photographs of seedlings, young trees, and mature trees, you arrange them in order of growth. But the analogy contains an important condition: observation has already taught us how trees usually grow from seedlings. The photographs are easy to sort partly because we bring prior knowledge of the growth process.
With cellular snapshots, many of the intermediate processes are precisely what has not yet been directly observed. Researchers must use measured molecular features, such as gene expression, to connect cells in similar states and infer where they may lie within a process. The “sequence” here is an inference drawn from data and models, and it needs further testing.[8]
Existing knowledge also plays a part. Which molecular features merit comparison, how differences are assessed, and which end should serve as the starting point may all involve choices of analytical method and biological judgment. Researchers might, for example, use known cell markers or sampling times to help establish a trajectory's direction. Different methods handle these questions differently. Researchers therefore need to state the evidence and assumptions used in their analysis and test whether the findings are robust.[8]
The value of pseudotime lies in proposing testable clues to a process from large numbers of snapshots. A smoothly ordered sequence cannot establish that one cell actually traveled that route, nor can it directly tell us how many hours or days elapsed between neighboring positions.
To connect “what a cell resembles now” more firmly with “what it later becomes,” researchers also add lineage tracing. A 2020 study of blood-cell formation used expressed DNA barcodes to track cells and their descendants, alongside transcriptome analysis. The study also found that some fate biases could not be fully read from single-cell RNA sequencing.[9]
This reminds us that even a detailed molecular snapshot may miss factors that influence the future. Understanding cell fate requires links between state, history, and subsequent outcomes.
© Before the Conclusion | Original concept; AI-assisted illustration. No republication, copying, modification, or commercial use without permission.
6. With richer data, the valleys become less orderly
The classic landscape most readily suggests that cells travel downhill, make a binary choice at each fork, and eventually enter their own valleys.
Reality adds less tidy lines to the picture.
A study published in Cell in 2021 analyzed 153 individually sampled mouse embryos, covering approximately 36 hours of early developmental change. The researchers found that the formation of many lineages involved combinatorial, multidirectional differentiation that could not be fully described by a hierarchy of nested binary choices.[10]
This does not mean development is disorderly. It means that an easily understood branching diagram may depict the real process too neatly. We would like clear forks in the road, but the data do not always oblige.
In August 2026, PLOS Biology published another study of neural development. Using neural progenitor cells formed in vitro from mouse embryonic stem cells as their main experimental system, the researchers combined single-cell data, dynamical systems models, and experiments to analyze the effects of Sonic Hedgehog signaling. They found that initially separate routes could pass through different intermediate processes to reach the same fate. Their model also successfully predicted cellular responses under dynamic signaling conditions that had not been used to fit it.[11]
Different routes reaching the same outcome add a new possibility to the classic picture: some valleys branch apart, while some routes can converge again.
And “successful prediction” carries more weight than “looking similar.” With enough flexibility, we can always draw a plausible-looking path around existing data. The real test of a model comes when it must specify in advance how cells will respond to a changed signal and allow new experiments to test that prediction.
The landscape itself must also change with the conditions. In dynamical systems models, external signals can make a stable state disappear or alter which state a cell moves toward. Researchers therefore need to explain how conditions shape the states that can persist and how cells move between them.[6]
In developing tissues, a cell's conditions also include signals from other cells. Communication between cells makes development a process of mutual influence. In the language of the landscape, cells both move through the terrain and help shape the terrain they will encounter next.[1]
These studies thus support a more specific way of explaining development: in the systems studied, cells occupy relatively stable states, transitions between states depend on conditions, and those transitions can be modeled, predicted, and tested. Giving mathematical meaning to the heights and slopes in the picture still does not mean there is a little mountain hidden inside a cell.
7. Can the ball climb uphill again?
If mature cells lie lower down the landscape, a natural question follows: can they go back?
In 2006, Shinya Yamanaka and Kazutoshi Takahashi reported that, under specific culture conditions, introducing four regulatory factors could reprogram mouse fibroblasts into cells with pluripotent properties. In 2007, their team also generated induced pluripotent stem cells from human fibroblasts.[12][13]
“Pluripotent” here means that these reprogrammed stem cells have regained broad differentiation potential. Under suitable conditions, they can go on to form nerve cells, muscle cells, blood cells, and others, with potential extending to almost every cell type that makes up the human body. It does not mean that a single such cell could independently develop into a complete person.
Returning to the landscape metaphor, we seem to see the ball regain the opportunity to enter other valleys. But this “going back” cannot simply be understood as playing the original downhill journey in reverse. Researchers introduce regulatory factors and use specific culture conditions to change regulatory relationships inside the cell, enabling it to re-enter a pluripotent state.[12][13]
The experiments establish a pathway that can achieve this transition. They do not mean that cells retraced every step of natural differentiation. Nor do they show that these experimental conditions are the only workable ones, or that they fully recreate the embryonic environment in which pluripotency forms and is maintained. “How to induce a cell to enter a state” and “how to keep it in that state” are also related but different questions.
This advances the question left by Gurdon's experiments. Cells that have acquired specialized functions may still retain potential that can be called upon again under particular conditions. Although their identity has been established and is quite stable in everyday conditions, specific interventions may still change it.
For regenerative medicine, this understanding offers clear research directions: how can we establish the cell state we need, increase the proportion of cells reaching the target, and help them retain appropriate function in their subsequent environment? “Looking more like the target cell” is only one observation. We also need to know what the cell can actually do.
The fact that cell fate can be changed gives us an opportunity to learn how to intervene. How far those interventions can go must still be answered by specific experiments.
8. A picture may change the questions we ask
At this point, it is hard to see Waddington's little ball as simply following a route drawn in advance, with nothing to do but complete the journey.
Genes, regulatory networks, cellular states, external signals, and developmental history need to be brought into the same explanation. Genetic information makes many processes possible. Specific molecular activities and interactions turn those possibilities into reality at particular times and places.
There is also a question worth retaining: when we ask what a living system “is,” what sort of answer are we hoping to find?
If the answer is only an inventory of components, we gain much important information but may still not know how the system works. Listing every instrument used in a performance does not let us hear the music. Similarly, identifying genes involved in development must be followed by an understanding of their connections, the order of their actions, and their feedback.
This is no attempt to substitute an elegant metaphor for molecular mechanisms. On the contrary, a good metaphor should help us pose more specific questions: which state can persist? What change in conditions will destabilize it? Do two apparently identical cells truly have the same future? Can a model's predicted route withstand tests using tracking and intervention experiments?
The word “fate” readily invites comparisons with human lives. But evidence about cellular differentiation cannot directly establish whether people can change themselves, nor can it answer questions about free will for us. Its insight is more limited and more firmly grounded: an established outcome needs to be understood in the context of the conditions that produced and sustain it. Stability and immutability are different questions.
Perhaps Waddington's picture has endured because it gave a process that is difficult to see directly a form from which discussion could begin. Modern research best carries it forward by gradually turning its valleys, forks, and pulling relationships into questions that can be measured and challenged.
A picture's value may be that it finally lets us see a question. Its longer life comes from those who return with data, erase a few lines, and draw some new ones.
The little ball is still on the hillside. Now we are beginning to have ways to find out why it goes where it does.
Further reading and references
A Quanta report prompted this article's subject. The article develops its own discussion using scientific history and original research; it is not a translation of that report. Original research, historical materials, and links for viewing the original drawings are listed below for further reading and verification.
Philip Ball. “How Does Life Unfold? A Landscape Metaphor Comes Into Its Own.” Quanta Magazine, 2026-10-09. The source of the topic and background on contemporary research.
https://www.quantamagazine.org/how-does-life-unfold-a-landscape-metaphor-comes-into-its-own-20261009/C. H. Waddington. The Strategy of the Genes, 1957. The epigenetic landscape is Figure 4 (page 29); the view from below, showing the pulling relationships as cords and pegs, is Figure 5 (page 36). Superscript 2 in the text refers to this entry.
View the digitized book, original drawings, and licensing information at the Wellcome Collection. The collection lists the digital edition's license as CC BY-NC 4.0. This article provides external viewing links to the original drawings rather than reproducing them. Its cover and in-text illustrations are independently drawn conceptual illustrations based on the scientific concepts.
For historical background, also see the Arizona State University Embryo Project Encyclopedia: Adam R. Navis, “Epigenetic Landscape,” 2007-10-30.J. B. Gurdon. “The developmental capacity of nuclei taken from intestinal epithelium cells of feeding tadpoles.” Journal of Embryology and Experimental Morphology, 1962;10:622–640. Also see the official scientific background for the 2012 Nobel Prize in Physiology or Medicine.
https://pubmed.ncbi.nlm.nih.gov/13951335/
https://www.nobelprizemedicine.org/wp-content/uploads/2012/10/PR_2012_01.pdfC. H. Waddington. “The Epigenotype.” Originally published in 1942; reprinted in International Journal of Epidemiology, 2012;41(1):10–13. DOI: 10.1093/ije/dyr184.
https://academic.oup.com/ije/article-abstract/41/1/10/648029R. L. Davis, H. Weintraub, A. B. Lassar. “Expression of a single transfected cDNA converts fibroblasts to myoblasts.” Cell, 1987;51(6):987–1000. DOI: 10.1016/0092-8674(87)90585-X.
https://pubmed.ncbi.nlm.nih.gov/3690668/
On how MyoD regulates muscle genes and changes chromatin state, also see A. N. Gerber et al. “Two domains of MyoD mediate transcriptional activation of genes in repressive chromatin: a mechanism for lineage determination in myogenesis.” Genes & Development, 1997;11(4):436–450. DOI: 10.1101/gad.11.4.436.
https://pubmed.ncbi.nlm.nih.gov/9042858/M. Sáez et al. “Statistically derived geometrical landscapes capture principles of decision-making dynamics during cell fate transitions.” Cell Systems, 2022;13(1):12–28.e3; published online 2021-09-17. DOI: 10.1016/j.cels.2021.08.013.
https://pubmed.ncbi.nlm.nih.gov/34536382/
https://pmc.ncbi.nlm.nih.gov/articles/PMC8785827/N. Balaskas et al. “Gene regulatory logic for reading the Sonic Hedgehog signaling gradient in the vertebrate neural tube.” Cell, 2012;148(1–2):273–284. DOI: 10.1016/j.cell.2011.10.047.
https://pubmed.ncbi.nlm.nih.gov/22265416/C. Trapnell et al. “The dynamics and regulators of cell fate decisions are revealed by pseudotemporal ordering of single cells.” Nature Biotechnology, 2014;32:381–386. DOI: 10.1038/nbt.2859.
https://www.nature.com/articles/nbt.2859
https://pubmed.ncbi.nlm.nih.gov/24658644/
For assumptions, starting-point selection, and analytical robustness in pseudotime methods, also see the original methods study: K. Street et al. “Slingshot: cell lineage and pseudotime inference for single-cell transcriptomics.” BMC Genomics, 2018. DOI: 10.1186/s12864-018-4772-0.
https://pmc.ncbi.nlm.nih.gov/articles/PMC6007078/C. Weinreb et al. “Lineage tracing on transcriptional landscapes links state to fate during differentiation.” Science, 2020;367(6479):eaaw3381. DOI: 10.1126/science.aaw3381.
https://pubmed.ncbi.nlm.nih.gov/31974159/M. Mittnenzweig et al. “A single-embryo, single-cell time-resolved model for mouse gastrulation.” Cell, 2021;184(11):2825–2842.e22. DOI: 10.1016/j.cell.2021.04.004.
https://pubmed.ncbi.nlm.nih.gov/33932341/M. Fontaine et al. “Dynamic Landscape Analysis of cell fate decisions provides predictive models of neural development from single-cell data.” PLOS Biology, 2026;24(8):e3003953; published 2026-08-26. DOI: 10.1371/journal.pbio.3003953.
https://journals.plos.org/plosbiology/article?id=10.1371/journal.pbio.3003953K. Takahashi, S. Yamanaka. “Induction of pluripotent stem cells from mouse embryonic and adult fibroblast cultures by defined factors.” Cell, 2006;126(4):663–676. DOI: 10.1016/j.cell.2006.07.024.
https://pubmed.ncbi.nlm.nih.gov/16904174/K. Takahashi et al. “Induction of pluripotent stem cells from adult human fibroblasts by defined factors.” Cell, 2007;131(5):861–872. DOI: 10.1016/j.cell.2007.11.019.
https://pubmed.ncbi.nlm.nih.gov/18035408/US National Cancer Institute (NCI), “Hormone Therapy for Breast Cancer”; NCI SEER, “ESR1.” Used to verify the estrogen receptor's transcriptional regulatory role, mechanisms of drugs such as tamoxifen, and differences between tissues.
https://www.cancer.gov/types/breast/treatment/hormone-therapy
https://seer.cancer.gov/seertools/glossary/view/555a1f38e4b031c70bba8ea5/?q=%5EEDailyMed, “PIOGLITAZONE tablet,” prescribing information, section 12.1 (Mechanism of Action). Used to verify the relationship among pioglitazone, PPARγ, and insulin sensitivity.
https://www.dailymed.nlm.nih.gov/dailymed/drugInfo.cfm?setid=692e662a-3b31-42c3-a075-42abe44c74dbUS National Library of Medicine, MedlinePlus Genetics, “TP53 gene.” Used to verify p53's role in the DNA-damage response, control of cell proliferation, and cancer.
https://medlineplus.gov/genetics/gene/tp53/
Text and image usage
This article was independently written by Before the Conclusion; its sources are listed above. The illustrations were conceived by Before the Conclusion and created with the assistance of AI tools. You are welcome to share the article's webpage link. Without permission, do not copy, repost, redistribute screenshots, or use the images separately. Commercial use is prohibited.